|
|
Post by Old Badger on Apr 6, 2015 16:57:11 GMT -5
A lot of political science research suggests that the outcomes of presidential elections can be explained mostly by just a few key variables. The most important: growth in real (inflation-adjusted) disposable income. But not growth over the long run. No, voters seem to respond to how fast their real disposable income has grown in the two quarters or so just before the election. This can be summed up as: "What have you done for me lately?" A second variable is how long the current party has been in power; it's unusual for either party to win more than two or perhaps three elections in a row because voters build up animosities and always are open to the call for something new. This can be summed up as: "Throw the bums out!"
If you combine these two into a single score using a standard statistical technique (multiple regression analysis) and use it as one axis on a graph, with the incumbent party's winning/losing election margin on the other axis, you get this very striking result covering the whole post-WWII period:

Statistically, just this one constructed variable, which Larry Bartels calls "tenure-adjusted growth in real disposable income," explains nearly 80 percent of the incumbent party's winning or losing margin in those 17 elections. NOTE: this is not a predictive model; we don't even have data on either disposable incomes or the election outcomes until after the election, after all. But it does suggest that the "fundamentals" are far more important than what we typically pay attention to during election campaigns, including gaffes, "scandals", speeches, get-out-the-vote efforts, and so on. Mostly that's because those other things largely cancel each other out: both parties do them, and the differences in how well they do them mostly are at the margins.
The full article is here.
It's worth keeping this in mind as a flock of candidates begins to roll out formal announcement in the coming weeks. This model doesn't deal with primaries, of course, which have a very different dynamic. But eventually we will have a general election, and that's where this stuff will come in handy. With that in mind, I'm pinning it for future reference. |
|
|
|
Post by goldenbucky on Apr 6, 2015 19:49:37 GMT -5
Interesting stuff! I've applied multiple regression analysis to a number of things at work - not political data though. Always fun to see where that goes.
|
|
|
|
Post by Old Badger on Apr 14, 2015 9:27:53 GMT -5
Here's what the underlying equation says:
Incumbent Party Margin = 9.93 + 5.48 × Income Growth – 1.76 × Years in Office.
In other words, the incumbent party starts off with nearly a 10-point advantage (roughly 55 percent vs. 45 percent for the other party). To that add 5 1/2 points for every 1 percent of income growth (or deduct that much if income growth is negative), and subtract 1 3/4 points for each year the party has been in office. Assume, for example, that next year income growth for the two quarters before the election is 0.5 percent. This formula says that, all other things being equal, the Dem candidate should have a margin vis-à-vis the GOP candidate of:
9.93 + 2.74 - 14.08 = -1.41
That's a narrow GOP win. If income growth is 1 percent:
9.93 + 5.48 - 14.08 = 1.33
A narrow Dem win. Look for a close election, in other words.
|
|
|
|
Post by muddydove on Apr 16, 2015 18:58:11 GMT -5
Regarding just about any issue ever:
Where you stand depends on where you sit.
|
|
|
|
Post by Old Badger on May 11, 2015 23:59:05 GMT -5
Political scientist Larry Sabato and colleagues provide an early look at the electoral vote playing field: "In the current Electoral College battlefield, 40 of 50 states have voted for the same candidate in all four elections since 2000. And, of the 10 exceptions, three were fluky...That leaves just seven super-swingy states: Colorado, Florida, Nevada, Ohio, and Virginia, all of which backed Bush and Obama twice each, and Iowa and New Hampshire, which have voted Democratic in three of the last four elections...This map feels like déjà vu: It’s effectively the same map we featured for much of the 2012 cycle, and it unmistakably suggests the Democratic nominee should start the election as at least a marginal Electoral College favorite over his or (probably) her Republican rival." link

It is important to understand that these are not state-by-state predictions, and that the coming election is likely to be close to a toss-up for a variety of reasons. But what's important here is that the playing field is much narrower than it was in 1976, when 20 state were decided by margins of 5 percentage points or less; in 2012 only 4 states were that close. The short story here is that the GOP candidate probably needs to take both Ohio and Florida to win, and the Dem needs Virginia. |
|
|
|
Post by Old Badger on Jun 11, 2015 23:32:52 GMT -5
Yes, fewer elections. Why? Because then we'd have better elections. If that sounds backwards, consider this:
"One of political science’s better-established findings is that “the frequency of elections has a strongly negative influence on turnout,” as Arend Lijphart of the University of California at San Diego put it in a 1997 article...
"In theory, frequent elections enhance the ordinary person’s influence over government and give him or her a strong incentive to stay abreast of the issues...In practice, it’s costly — in time, effort and, indeed, money — to stay politically informed and active. Those costs must be weighed against the potential benefits of participating in an election whose results might last no more than a couple of years, to the extent they affect you personally at all. Frequent elections therefore bring on what Lijphart calls “voter fatigue.”
"In a famous paper nearly 30 years ago, Richard W. Boyd of Wesleyan University found that the introduction of presidential primaries in northern states after 1968 accounted for a 10 percentage-point drop in those states’ general-election voter turnout by 1980." link
The United States is nearly unique among advanced democracies in holding so many elections at so many levels of government, at so many different times of year. Nearly, but not fully unique: "The United States and Switzerland don’t have much in common, but they both have (a) frequent elections, with Switzerland holding at least three or four national votes per year, in addition to cantonal elections, and (b) relatively low voter turnout. A mere 49.1 percent of registered Swiss voters cast ballots in the 2011 national parliamentary elections."
In some states, such as Kentucky, Louisiana, New Jersey, and Virginia, state elections are held in odd-numbered years, almost guaranteeing low-information campaigns and low turnout. Local elections in many states, such as Wisconsin, are held in the spring rather than at the "normal" time in November. When I lived in Michigan I discovered that there were more than 100 offices elected state-wide, mainly because the three largest state universities had Boards of Trustees who were elected. Here I was, a political scientists working at one of those very universities, and I had no idea who any of those candidates were or what they stood for (media do not cover elections to such offices much, if at all).
Unfortunately, calls for more sensible electoral systems have been ignored for decades, and it's not in any elected official's interest to raise the issue--after all, they were elected under the current system, so it's working for them. But if I had my druthers, we would elect the House and half the Senate at each presidential election; state and local elections would be held on the same day as the national election; election day would be a national holiday, as it is in many democracies; and the number of directly-elected state and local offices would be reduced drastically. Elected school boards, water and sewerage boards, park boards, university boards, etc. simply invite special-interest manipulation, while actually reducing accountability. Let's make governors, county executives, and mayors responsible for managing all those functions so we can hold those officials accountable for how the agencies of government are performing.
Pipe-dreaming, but it's the political scientist in me.
|
|
|
|
Post by Old Badger on Oct 26, 2015 15:56:38 GMT -5
|
|
|
|
Post by bigapplebucky on Oct 28, 2015 16:07:43 GMT -5
This will be Nate Silver's (538) first presidential election with his own website. I hope it will be as accessible as his blog on the Times site was. Given his reputation for accuracy, I fear he'll try to cash in by adding a paywall. ***As of October 28*** It appears Trump has finally given up his national and Iowa leads in the polls to Ben Carson. From my POV, Carson and Trump have little significant difference except in style. |
|
|
|
Post by Old Badger on Nov 17, 2015 17:59:46 GMT -5
Latest UMass national poll results are out.
Republicans
Trump - 31 Carson - 22 Cruz - 13 Rubio - 9 All others - less than 5 percent each
Democrats
Clinton - 63 Sanders - 29 |
|
|
|
Post by Old Badger on Nov 22, 2015 15:37:10 GMT -5
WP-ABC poll, Nov. 16-19:
Among Republican identifiers/leaners:
Trump - 33 percent Carson - 22 Rubio - 11 Cruz - 7 Bush -5 Everyone else >5
Among Democratic identifiers/leaners:
Clinton - 59 Sanders - 35 O'Malley - 2
Trump has led the WP-ABC poll for four consecutive months.
link
|
|
|
|
Post by Old Badger on Nov 24, 2015 16:10:41 GMT -5
Nate Silver explains why polls now are a poor guide to voting in the upcoming primaries/caucuses:
"It can be easy to forget it if you cover politics for a living, but most people aren’t paying all that much attention to the campaign right now. Certainly, voters are consuming some campaign-related news. Debate ratings are way up, and Google searches for topics related to the primaries have been running slightly ahead of where they were at a comparable point of the 2008 campaign, the last time both parties had open races. But most voters have a lot of competing priorities. Developments that can dominate a political news cycle, like Trump’s frenzied 90-minute speech in Iowa earlier this month, may reach only 20 percent or so of Americans.
"We can look deeper into the Google search data for some evidence of this. In the chart below, I’ve tracked the aggregate share of primary-related searches in the 2008 and 2012 presidential cycles, based on the number of weeks before or after the Iowa caucuses.2 As you can see, public attention to the race starts out quite slow and only gradually accelerates — until just a week or two before Iowa, when it begins to boom. Interest continues to accelerate as Iowa, New Hampshire and the Super Tuesday states vote, before slowing down again once the outcome of the race has become clear...

"But maybe you don’t trust the Google search data. That’s OK; exit polls...have historically asked voters in Iowa and New Hampshire when they made their final decision on how to vote. These exit polls find that voters take their sweet time. In Iowa, on average, only 35 percent of voters had come to a final decision before the final month of the campaign. And in New Hampshire, only 29 percent had. (Why is the fraction lower in New Hampshire than in Iowa? Probably because voters there are waiting for the Iowa results before locking in their choice. In fact, about half of New Hampshire voters make up their minds in the final week of the campaign.) By comparison, voters decide much earlier in general elections. In Ohio in 2012, for example, 76 percent of voters had settled on Mitt Romney or Barack Obama by the end of September. This is why it’s common to see last-minute surges or busts in nomination races (think Rick Santorum or Howard Dean), but not in general elections." link
The reason why general elections are less volatile than primaries is simple: party labels matter. Even though the share of voters who claim to be "independents" has gone up over the past several decades, at the expense of both Democratic and Republican identifiers, when you include "leaners" the percentage of voters who cast ballots along party lines remains about as high as ever. Political scientists say that the parties "structure the vote" meaning that they provide important cues that help voters determine which candidate to support. But in primaries and caucuses that signal is missing: all the candidates are from the same party, so one of the most important pieces of information most voters rely on is absent. That's why, as more and more voters become engaged in the coming months, poll numbers likely will shift, often by a lot. This is especially true in the GOP race simply because there are so many candidates for voters to try to sort out. In a sense, Trump's lead now may reflect nothing more than that he's been the most-covered candidate, so when pollsters call voters--most of whom are paying little attention--they respond to his name because it's the name they've been hearing.
Good read. |
|
|
|
Post by bigapplebucky on Jan 13, 2016 12:09:23 GMT -5
Most recent PPP Iowa poll shows the birther issue may be hurting Cruz. Trump with a narrow lead. But in a two man race, Cruz easily beats Trump. Also Sanders narrowing the race with Hillary, but Hillary still has a nice lead among firmly committed voters.
|
|
|
|
Post by mudcannon on Jan 20, 2016 9:57:31 GMT -5
Once 538 starts projecting that's about the only prognostication you will need. They aggregate all polls and a myriad of other sources to get a true sense of who's leading.
|
|
|
|
Post by bigapplebucky on Jan 20, 2016 16:05:55 GMT -5
Once 538 starts projecting that's about the only prognostication you will need. They aggregate all polls and a myriad of other sources to get a true sense of who's leading. And they're predicting a relatively easy win for Hillary in Iowa and a lead for her in New Hampshire. Their analysis favors Hillary far more than the opinion polls. |
|
|
|
Post by mudcannon on Jan 20, 2016 19:58:40 GMT -5
Once 538 starts projecting that's about the only prognostication you will need. They aggregate all polls and a myriad of other sources to get a true sense of who's leading. And they're predicting a relatively easy win for Hillary in Iowa and a lead for her in New Hampshire. Their analysis favors Hillary far more than the opinion polls. They have Bernie leading in NH projects.fivethirtyeight.com/election-2016/primary-forecast/new-hampshire-democratic/ |
|
|
|
Post by Old Badger on Jan 21, 2016 0:34:02 GMT -5
They have Bernie leading in NH OK, so that led me to their "snapchat" from yesterday; worth the read: link. Consensus odds on Sanders winning the nomination: 5-15 percent. |
|
|
|
Post by Old Badger on Jan 26, 2016 15:06:10 GMT -5
I just merged two threads of background info on polling and political science into one...made no sense to have both.
|
|
|
|
Post by Old Badger on Apr 25, 2016 10:15:05 GMT -5
Gallup reported earlier this month that the Dems have regained their lead in party ID. 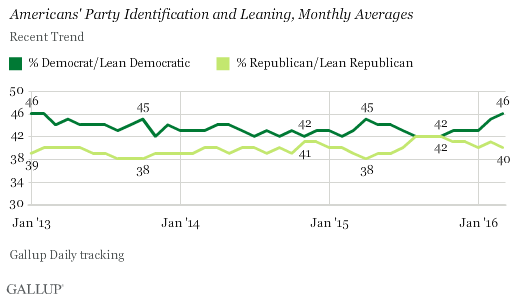 |
|
|
|
Post by Old Badger on Jun 15, 2016 12:16:57 GMT -5
This is fascinating--and scary (listen until the end):
|
|
|
|
Post by Old Badger on Jun 29, 2016 22:53:14 GMT -5
Two NYT headlines on their website, literally side by side:
Hillary Clinton and Donald Trump Are Deadlocked, Poll Shows
Donald Trump Slips Further Behind Hillary Clinton in New Polls
Journalists really should be banned from writing a word about polls. Virtually none of the political reporters understands even the rudiments of polling, much less how to interpret the results.
For the record, Real Clear Politics shows the average lead for Clinton across polls is about 7 percentage points nationally.
|
|
|
|
Post by Old Badger on Jul 13, 2016 14:35:05 GMT -5
|
|
|
|
Post by Old Badger on Jul 19, 2016 21:21:22 GMT -5
The NYT has developed a handy tool for figuring out which swing states each candidate needs to win to reach 270 EVs under various scenarios. At the moment--and all this is subject to change as the campaign progresses--there are 945 combinations that lead to a Clinton win and 72 for Trump. Oh, and there are 7 paths that lead to a 269-269 tie, if you want to consider nightmares. Also at the site they compare seven predictive models, overall and state-by-state. Right now, 4 of those models predict a 64-82 percent probability that Clinton will win, 2 "lean" toward a Clinton win, and 1 (based on markets) shows a tossup. None has Trump winning. The scenarios are fun to play with: link. |
|
|
|
Post by Old Badger on Jul 30, 2016 15:47:20 GMT -5
The election is 101 calendar days from today, July 30, which means there are fewer than 100 days of campaigning before the polls open. The UK could hold three elections in that time, of course, but we do things our own way here. In about 3 weeks we'll start getting poll numbers that are meaningful (i.e., no longer affected by temporary convention bounces). If one candidate emerges with a lead at that point, that candidate almost certainly will win, based on past history. Personally, I'm not worried about the outcome. |
|
|
|
Post by Old Badger on Aug 7, 2016 15:47:23 GMT -5
Poli Sci explains Trump:
|
|
|
|
Post by Old Badger on Sept 6, 2016 11:10:17 GMT -5
The WP conducted a 50-state poll between Aug. 9 and Sep. 1. The overall sample size was huge (74,000), but more important they had big samples for each state, so they could do so in-depth data analysis. For the big picture they found that 14 states with 187 EVs were solid for Clinton, 6 states with 57 EVs leaned her way, for a total of 244 of the 270 needed to win. On the other side of the ledger, 16 states with 98 EVs were strong for Trump, while 4 states with 28 EVs leaned his way, for a total of 126. They rated 10 states with 168 EVs as toss-ups. Their conclusion: Clinton has a big edge. linkOf course, they find that last group to include most of the usual suspects: Ohio, Florida, Arizona, Colorado, Wisconsin, (more dubiously) Michigan. But there are some surprises, most of them negative for Trump: Texas, Georgia, and Mississippi (?). The WP suggests that there some re-writing of the electoral map going on here, with Trump perhaps gaining in the Great Lakes and Clinton in the South. We'll see, but the results are kind of interesting. While I admire the effort, I'm dubious about this poll, however. For one thing, they used the online SurveyMonkey polling website. I have used this to do surveys myself, but I know that there's a built-in bias in term of who is reached and who actually participates with this method. Perhaps more importantly, however, the poll was taken over the course of nearly 4 weeks. On the plus side, they started long enough after the end of the conventions to allow any bumps to work their way out of the data; but on the downside, that long period of time means that they are not getting a snapshot at one point in time, but a kind of blurry image of a moving target. Mitigating this is that there was no substantial change in the trajectory of the race over that month, so perhaps it's less of a problem in practice than it could be in theory. |
|
|
|
Post by badgerjon66 on Sept 15, 2016 8:24:33 GMT -5
Update on polls: Real Clear Politics today. A trailing indicator as Trump trends up & Hillary down.
RCP Poll Average 45.8 44.0 Clinton +1.8Trending Down
4-Way RCP Average 42.0 40.9 Clinton +1.1Trending Down
Favorability Ratings -13.3 -20.2 Clinton +6.9
Betting Odds 68.0 32.0
Electoral College Clinton Trump Spread
RCP Electoral Map 209 154 Clinton +55
No Toss Up States 293 245
Battlegrounds Clinton Trump Spread
Florida 44.4 45.1 Trump +0.7Trending Up
New Hampshire 43.0 38.0 Clinton +5.0
Ohio 44.6 45.2 Trump +0.6Trending Up
Pennsylvania 46.8 40.6 Clinton +6.2
Iowa 41.5 42.3 Trump +0.8
Nevada 43.0 42.2 Clinton +0.8Trending Down
North Carolina 44.3 43.5 Clinton +0.8
Might want to pause the order for coronation champagne? The fat lady might be singing a swan song.
|
|
|
|
Post by Old Badger on Sept 15, 2016 9:05:27 GMT -5
Might want to pause the order for coronation champagne? The fat lady might be singing a swan song. Tell me all about it on Nov. 8, jon. ;-) |
|
|
|
Post by Old Badger on Oct 5, 2016 23:10:03 GMT -5
Most election polls cite a "sampling error" of + or - 3 or 3.5 percentage points, depending on the sample size. So, if a poll says Candidate X is favored by 54 percent of voters, with a 3 percent sampling error, it means that there's a 95 percent chance that between 51 and 57 percent of voters favor X--itself a rather wide range; 51 percent is a bare victory, 57 percent a landslide, but both are equally likely with a poll estimate of 54 percent. Sampling error takes account only of the random error introduced by sampling from a population rather than polling everyone (we call the latter the election). It is relatively easy to calculate the amount of sampling error because of the laws of statistics. Unfortunately, there are many other sources of error in poll estimates, and the size of these errors typically is unknown. In a helpful NYT article the authors provide empirical estimates that these errors, when added to sampling error, result in estimates that are + or - 7 percentage points, not 3. So, a poll number of 54 percent could mean a range of from 47 percent to 61 percent for the candidate--and yes, that's little better than just picking a number out of thin air. The sources of non-random error include: (1) sampling frame error (for example, a telephone survey won't include anyone without a phone); (2) response bias (for example, supporters of the losing candidate, or one seemingly going down, often are not willing to participate, while supporters of leading/rising candidates are); and (3) analysis error (given the same raw data, different survey analysts come up with different estimates because of how they deal with the data). And these are just some of the major issues You might wonder why millions are spent on polls if this is the best we can do (good question), but actually, most of the possibilities are closer to the poll estimate than that wide range would suggest. Being right 95 percent of the time is a pretty steep test; if you just want to be right, say, 80 percent of the time, the range of error is much lower. More importantly, averaging poll results tends to reduce the 95 percent accuracy range to something like 2 percentage points either way. So, it's not all hopeless, after all. |
|
|
|
Post by Old Badger on Nov 7, 2016 7:58:40 GMT -5
Columbia Political Scientist Andrew Gelman has a terrific piece on Vox explaining why all those swings in the polls most likely represent nothing more than changes in who responds to polls--or more precisely, who doesn't. He notes findings that when there's bad news for a candidate, his/her supporters are less likely to respond to pollsters; with response rates now down to about 10 percent, a rise in non-response among one candidate's supporters can have fairly notable effects on poll results. Averaging across polls actually can compound this problem. But the underlying vote is much more stable--very few voters actually change their minds during the fall campaign, so big apparent shifts really are just ephemeral, not real.d Bottom line for this election: Hillary never was as far ahead as most polls showed earlier this fall (and her campaign agrees), and Trump didn't suddenly catch up last week. She's held a modest but steady lead throughout. |
|
|
|
Post by goldenbucky on Nov 7, 2016 22:43:27 GMT -5
|
|


